
Our models track how asset relationships form, mutate, or fragment, giving you early warning when regimes shift or clusters break.
Spot new asset clusters forming
Track breakdowns in causal relationships
Adapt strategies as structures shift
Identify causal chains behind market movements. Anticipate sequences triggered by events like policy shifts, volatility bursts or macro data.


Track how shocks move through networks - momentum, volatility and flow - across connected assets, sectors or regions.
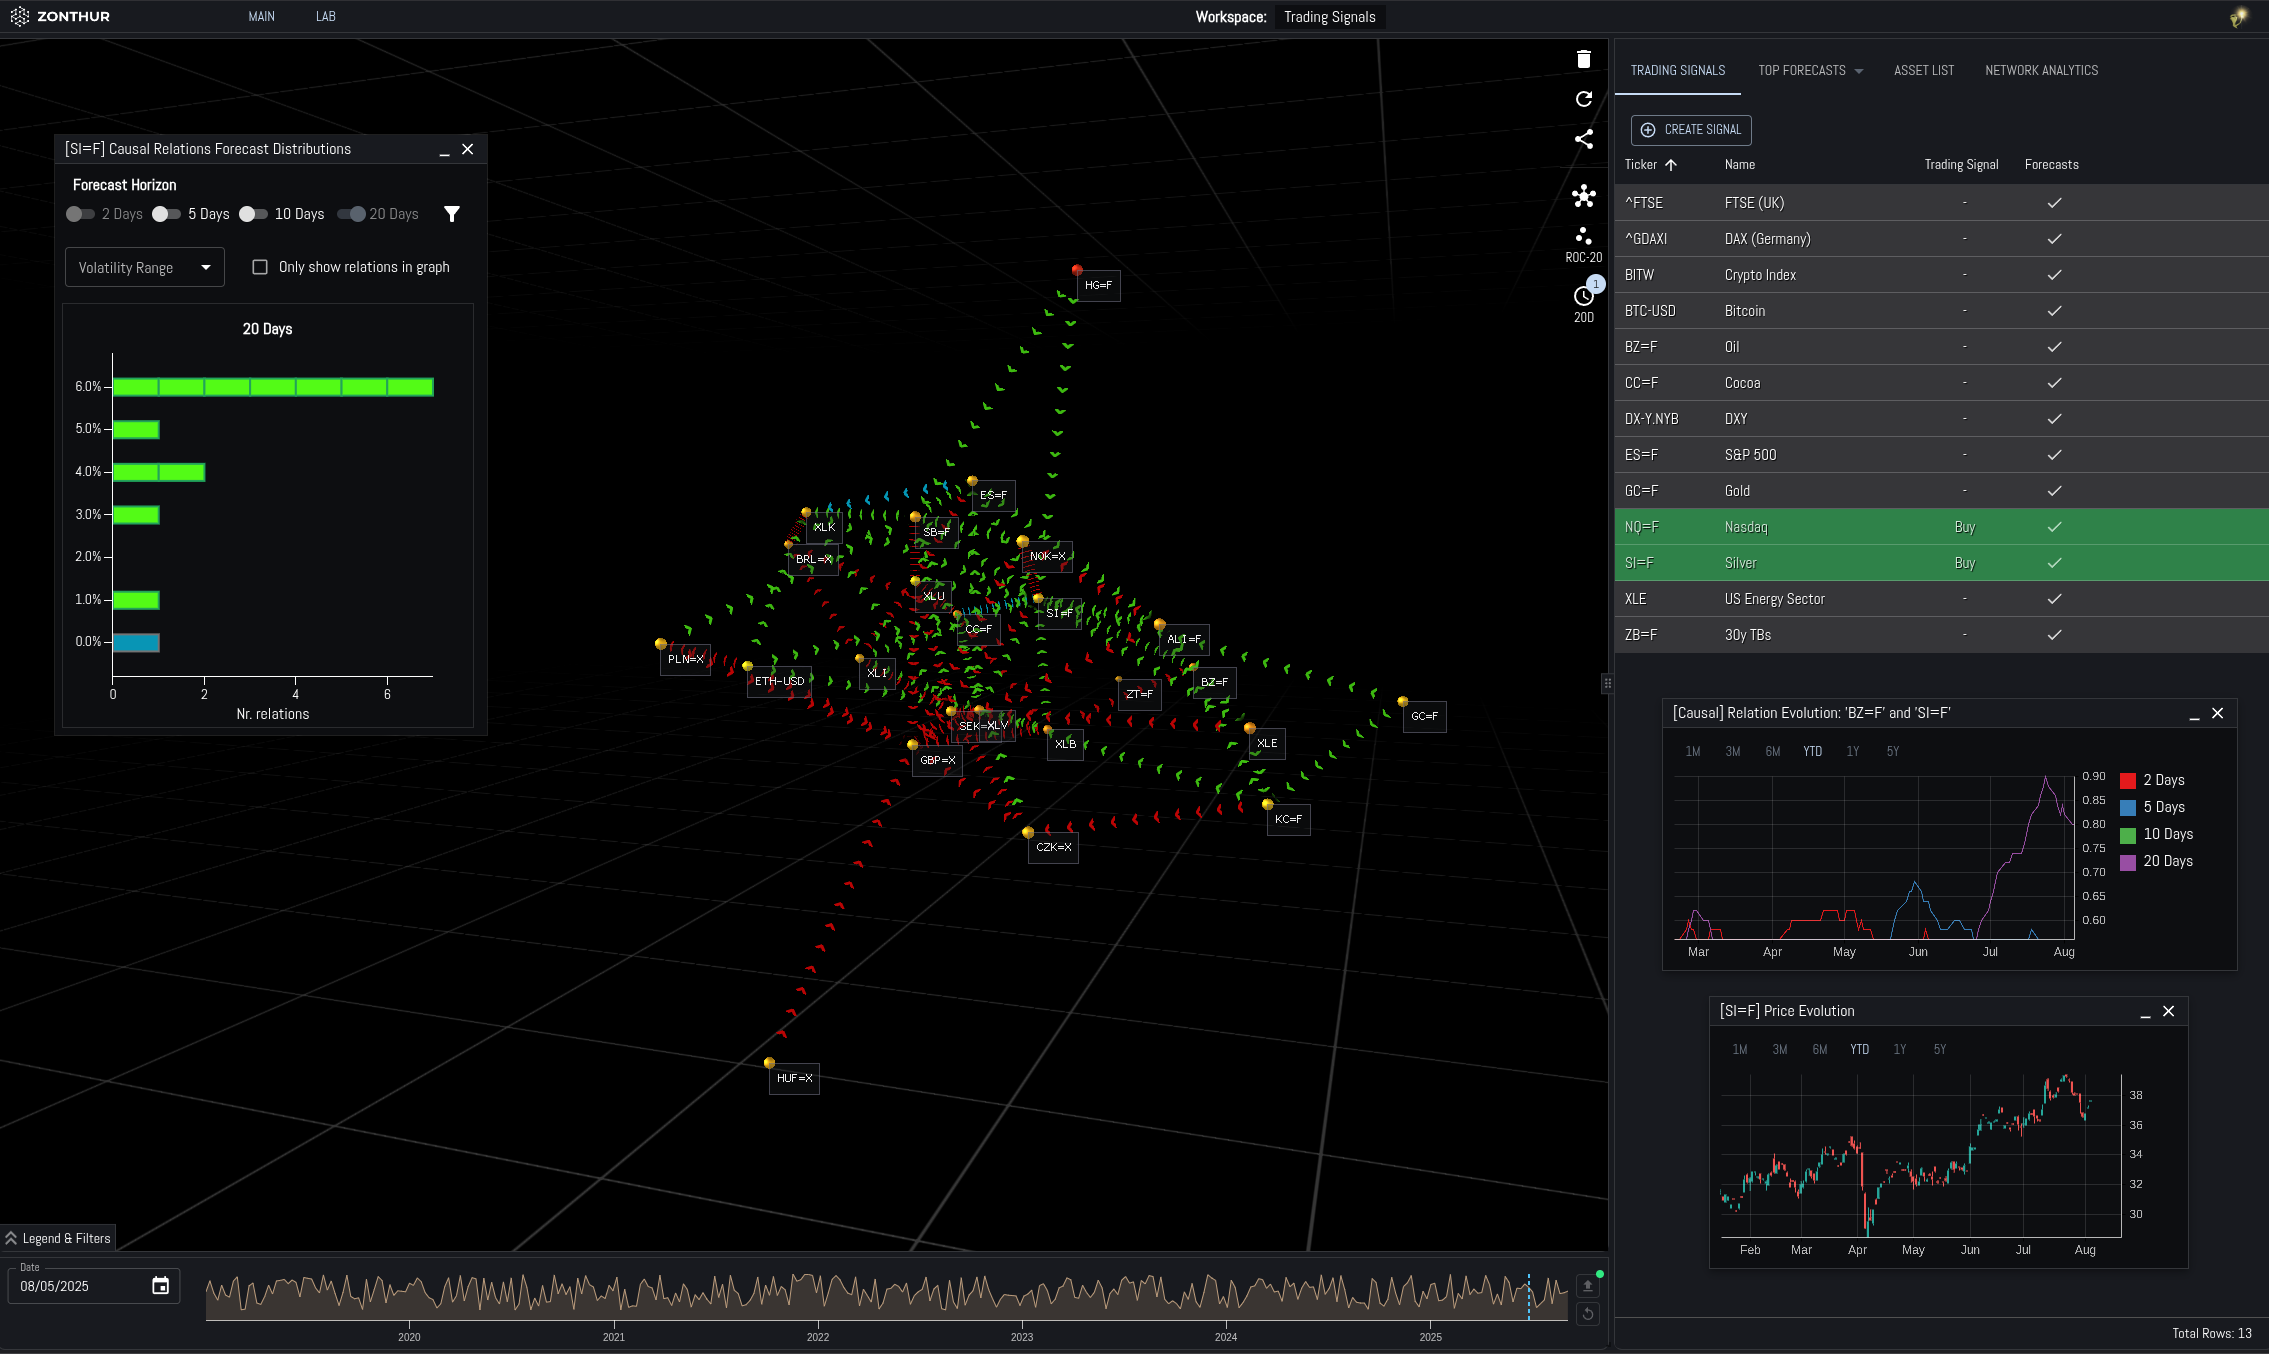
Zonthur maps how causal relationships between assets form, shift, and break down - built on five converging ideas from complexity science.
This methodology employs network graph analysis to connect individual asset price movements with broader, complex macroeconomic trends that are not fully captured through traditional charts or matrices.
Discover how Zonthur’s temporal network analysis can enhance your understanding of macroeconomic structures. Schedule a consultation with our team to learn more about our research methodologies.
Contact Sales
We welcome the opportunity to discuss how Zonthur’s research methodologies can support your objectives. Please reach out to our team for further information or to schedule a consultation.


